Understanding the Importance of P-Values in Statistical Analysis
May 19, 2024 By Susan Kelly
The concept of P-value is very important in statistical analysis, especially in finance. It helps to know how significant the results are. Knowing what a P-value means, how it's calculated, and why it's important can help make better decisions based on data. This article gives a detailed explanation about the P-value which includes its definition, calculation, and its role in statistical significance.
Definition and Interpretation of P-Values
A P-value, also known as probability value, is a measurement in hypothesis testing that shows how strong the evidence goes against the null hypothesis. It gives a numerical representation of the probability of achieving test results or more extreme ones seen in a study when we believe the null hypothesis to be true. The P-value helps us understand if what we see in data is because of random luck or if there's some actual effect happening.
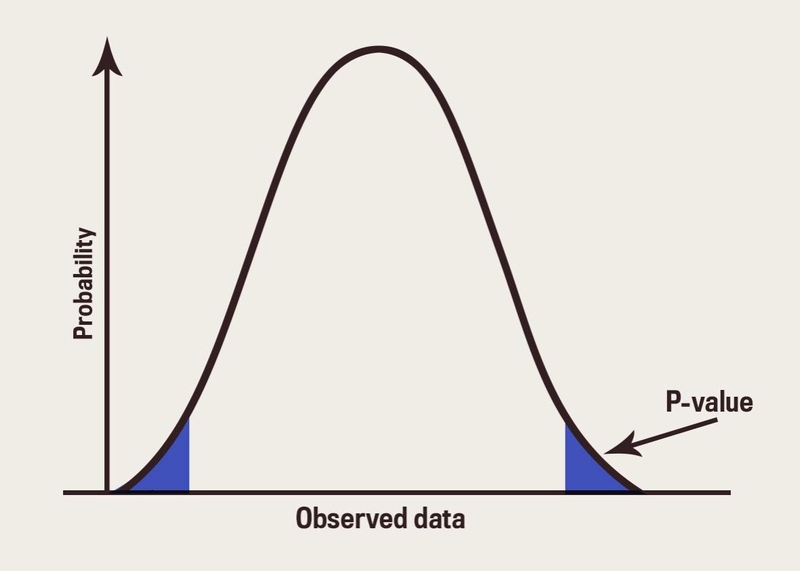
A smaller P-value implies that there is better evidence to oppose the null hypothesis. It indicates that the data observed is less probable to happen under this hypothesis. On the other hand, a bigger P-value suggests weaker proof against the null hypothesis; it means that data could be because of random fluctuation. Usually, a cut-off point or significance level (alpha) at 0.05 is employed for deciding statistical importance; if the P-value falls under alpha, we reject our null hypotheses.
- Significance Threshold: Commonly set at 0.05, but can vary depending on the field of study.
- Misuse Warning: Over-reliance on P-values without considering other statistical measures can be misleading.
Calculating the P-Value
The procedure for finding the P-value is different depending on what type of statistical test we are using. It could be a t-test, chi-square test, or ANOVA among others. The general process encompasses these stages. Hypotheses Construction: Establish the null hypothesis (H0) and alternative hypothesis (H1). Also, it involves picking the Test Statistic. Choose the suitable test statistic by considering the data type and hypothesis.
Next is finding the Test Statistic. Calculate the value of the test statistic with given sample data. Then, move to the Determining P-Value part. Find the P-value using statistical tables or software. After obtaining the calculated test statistic, you can compare it to the appropriate distribution and find the corresponding P-value. For instance, in a t-test, you would match up your t-statistic with the t-distribution to get its associated P-value. This matching process can be done manually by looking at statistical tables, but it is quicker and more accurate to use computer programs like R, Python, or even Excel which automate this task for you.
- Software Tools: Utilize R, Python, or Excel for precise and efficient P-value calculations.
- Test Types: Different tests (t-test, ANOVA) require specific steps for accurate P-value calculation.
Significance of P-Values in Finance
In the field of finance, we use P-values to measure the importance of different financial models and assumptions. For example, when studying how a new policy affects stock returns, analysts can apply a P-value to decide if the seen alterations in returns are statistically meaningful or just because of chance shifts.
Finance professionals benefit from Understanding P-values as it aids them in using data to make informed choices, decreasing the chance of committing Type I and II errors, and boosting their analysis's trustworthiness. For example, in regression analysis, the P-value linked with every coefficient shows if the variable has an important impact on the dependent variable or not.
- Model Validation: P-values help validate the accuracy of financial models.
- Error Reduction: Crucial for minimizing Type I (false positive) and Type II (false negative) errors.
Common Misinterpretations of P-Values
Even though the use of P-values is quite common, there are many misconceptions associated with them. One misunderstanding is that a P-value shows the probability of the null hypothesis being true. However, this value only measures how likely it is to observe data or something even more extreme if we assume the null hypothesis is correct. It does not provide a direct measure of the probability of the hypotheses themselves.
Another misunderstanding is the belief that if a P-value is less than the significance threshold, it means the result is meaningful or practically significant. Statistical importance does not always mean practical importance. So, we need to look at the effect size and findings' context along with P-value.
- True Meaning: P-value indicates data likelihood under the null hypothesis, not hypothesis truth.
- Practical Significance: Statistical significance does not always imply practical relevance.
Limitations of P-Values
Although P-values are useful for statistical analysis, they also have some limitations. One big problem is that their result depends on the size of the sample. If you have a very big sample, even small effects can turn into statistically important results which might lead to wrong understandings. On the other hand, when we have a small group or sample size, it might not show any important effects. This can lead to a Type II error.
Moreover, P-values cannot quantify the magnitude of an effect or its real-life importance. They also fail to consider previous data or the likelihood of a null hypothesis. So, it's necessary to employ P-values in combination with other statistical methods and surrounding details for correct result analysis.
- Sample Size Impact: Large samples can make trivial effects seem significant.
- Effect Size: P-values do not reflect the magnitude or importance of an effect.
Conclusion
P-values are very important in hypothesis testing and statistical analysis, especially for areas such as finance that depend on making decisions backed by data. By comprehending what P-values symbolize, how to compute them, and their importance, analysts can reach conclusions with more knowledge and trustworthiness. Nevertheless, it is just as crucial to understand their restrictions and ability for incorrect interpretation. The combination of P-values with other statistical methods and real-world thinking makes sure the data analysis is strong and complete.